Blog
Virtual environment for python to make Quarto run (foodexplorer DevBlog #3)
R
shiny
data visualization
devblog
Troubleshooting the devblog for starters (foodexplorer DevBlog #2)
R
shiny
data visualization
devblog
Introducing the foodexplorer project (DevBlog #1)
R
shiny
data visualization
devblog
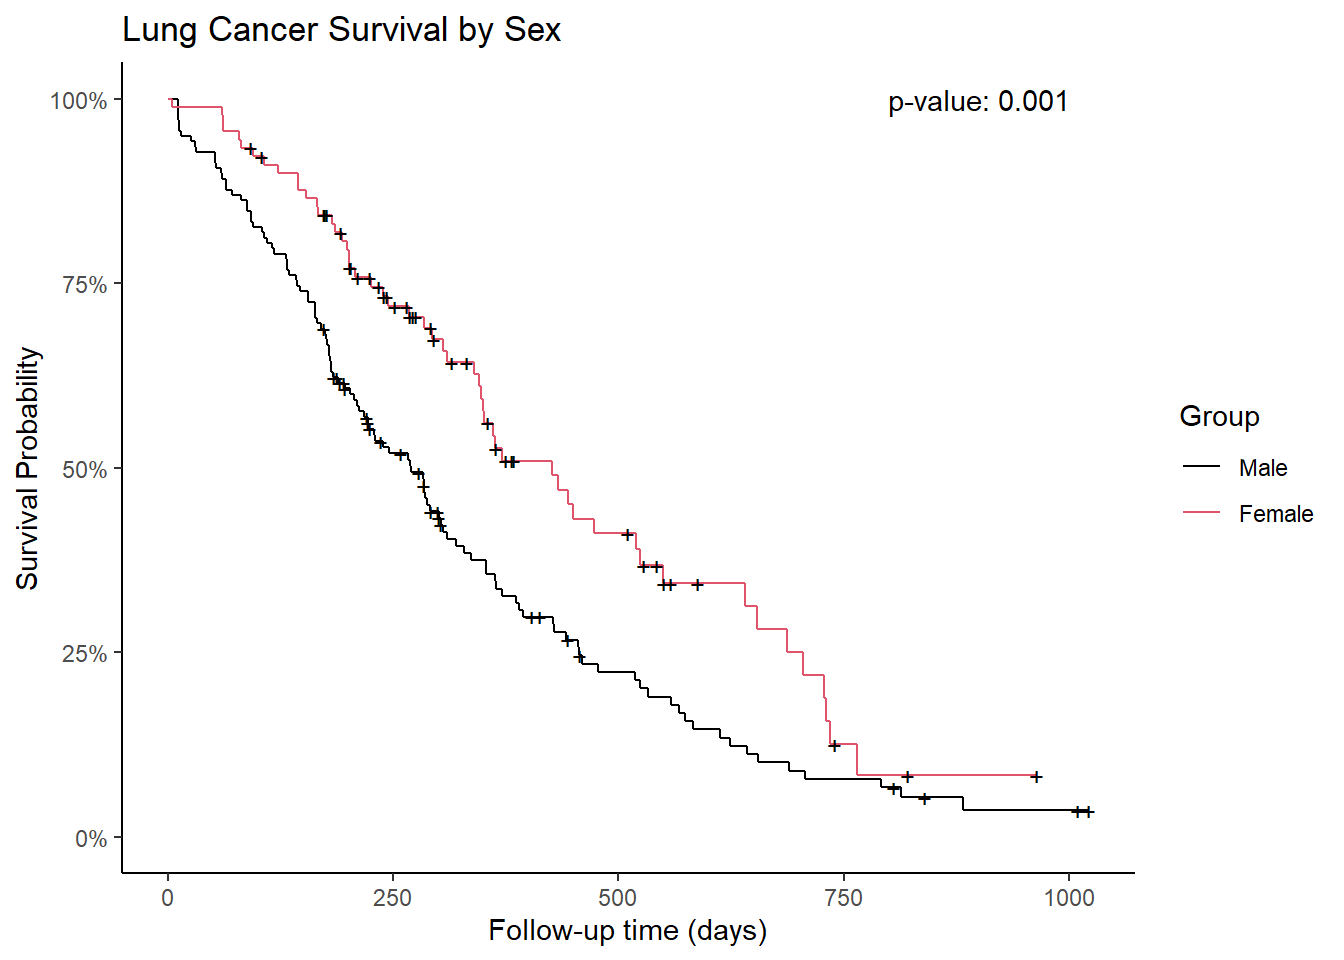
Enhancing Survival Analysis in R with Custom Functions
R
survival analysis
kaplan-meier plot
log-rank test
data visualization
ggplot2
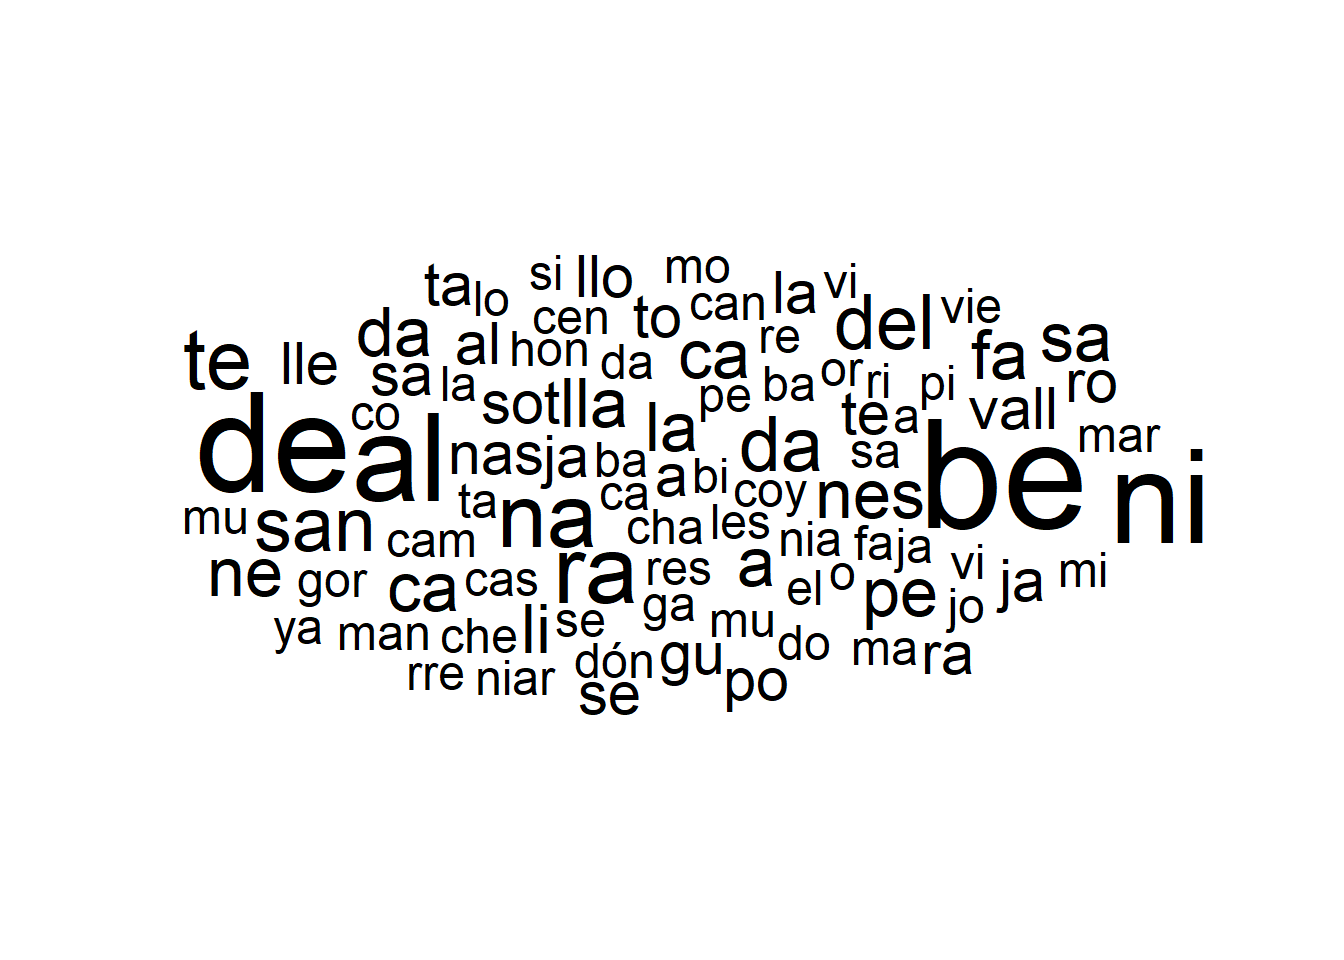
Generating Random City Names Based on Syllable Formation Rules
R
strings
functions
creative project
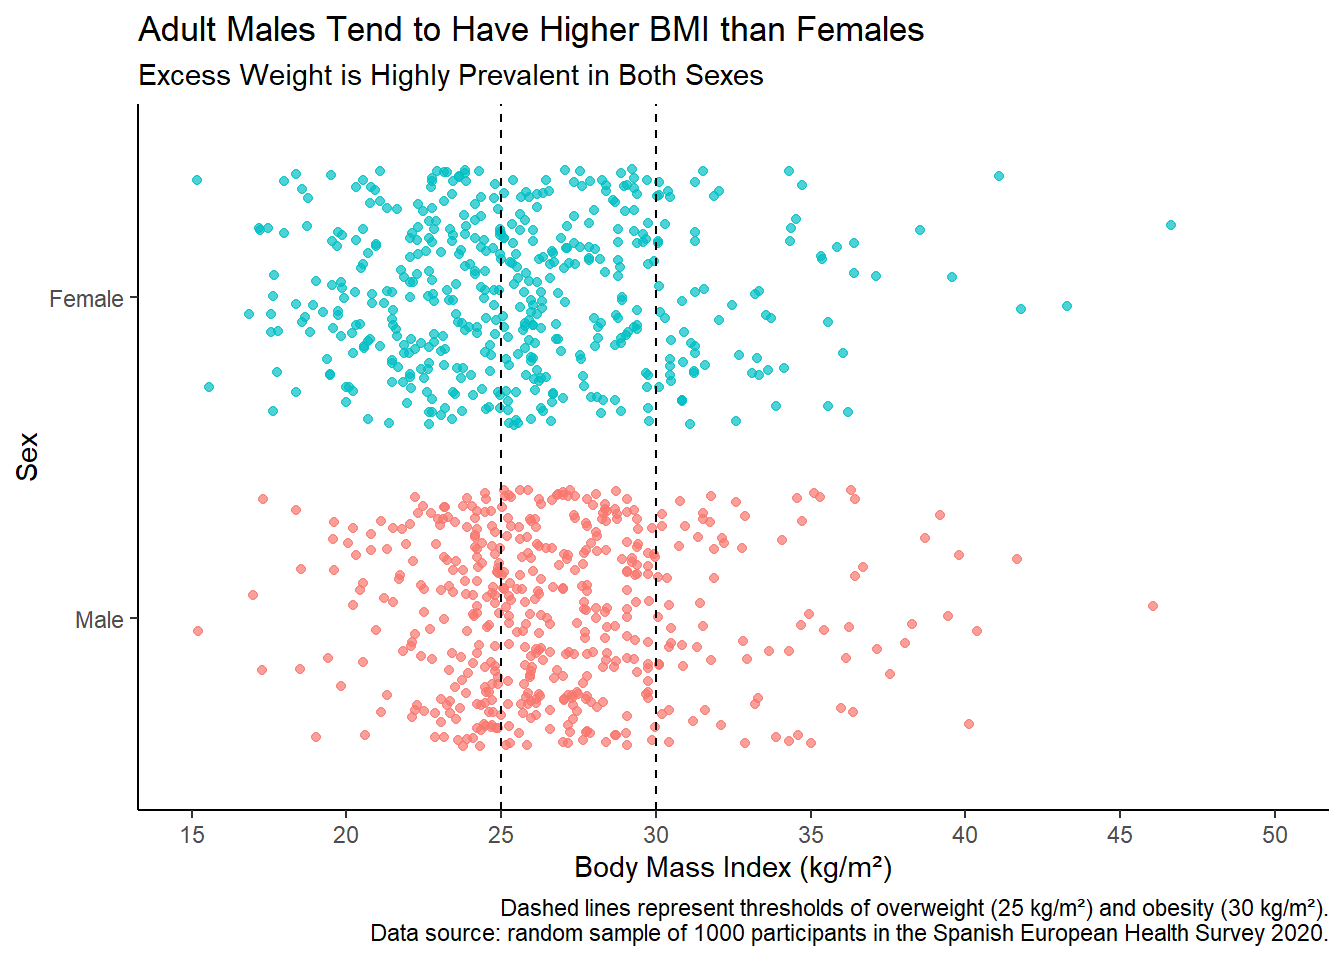
Daily Data Visualization with R: Jitter Plot
R
ggplot2
data visualization
tidyverse
health
jitter
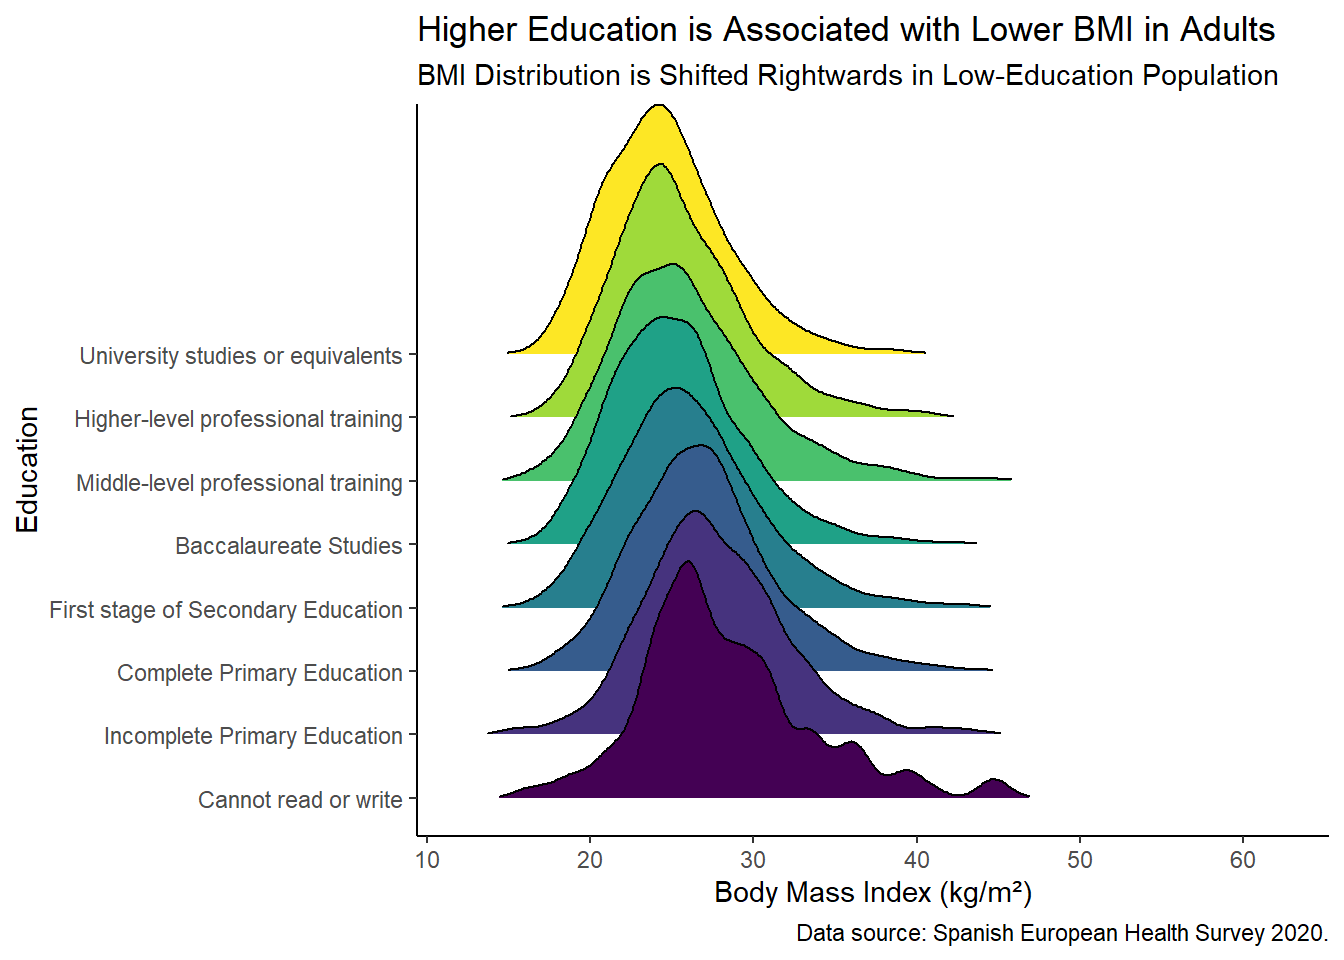
Visualizing BMI Distributions Across Educational Levels with ggridges
R
importing
data cleaning
ggplot2
ggridges
tidyverse
health
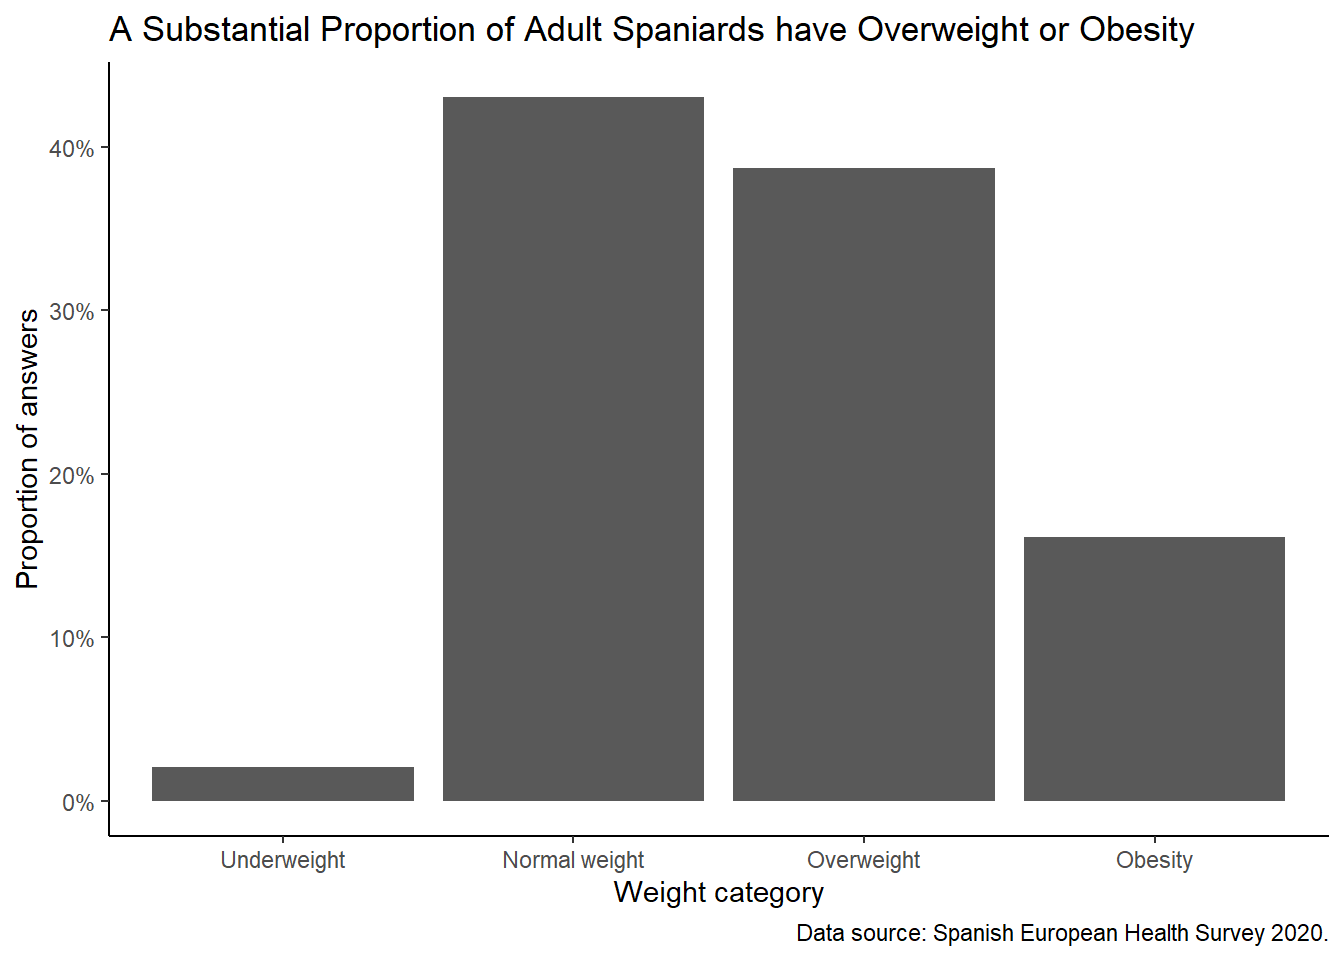
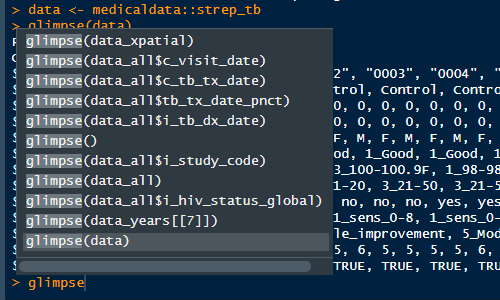
Load Data from the National Health Survey Spain 2020
R
importing
data cleaning
ggplot2
tidyverse
health
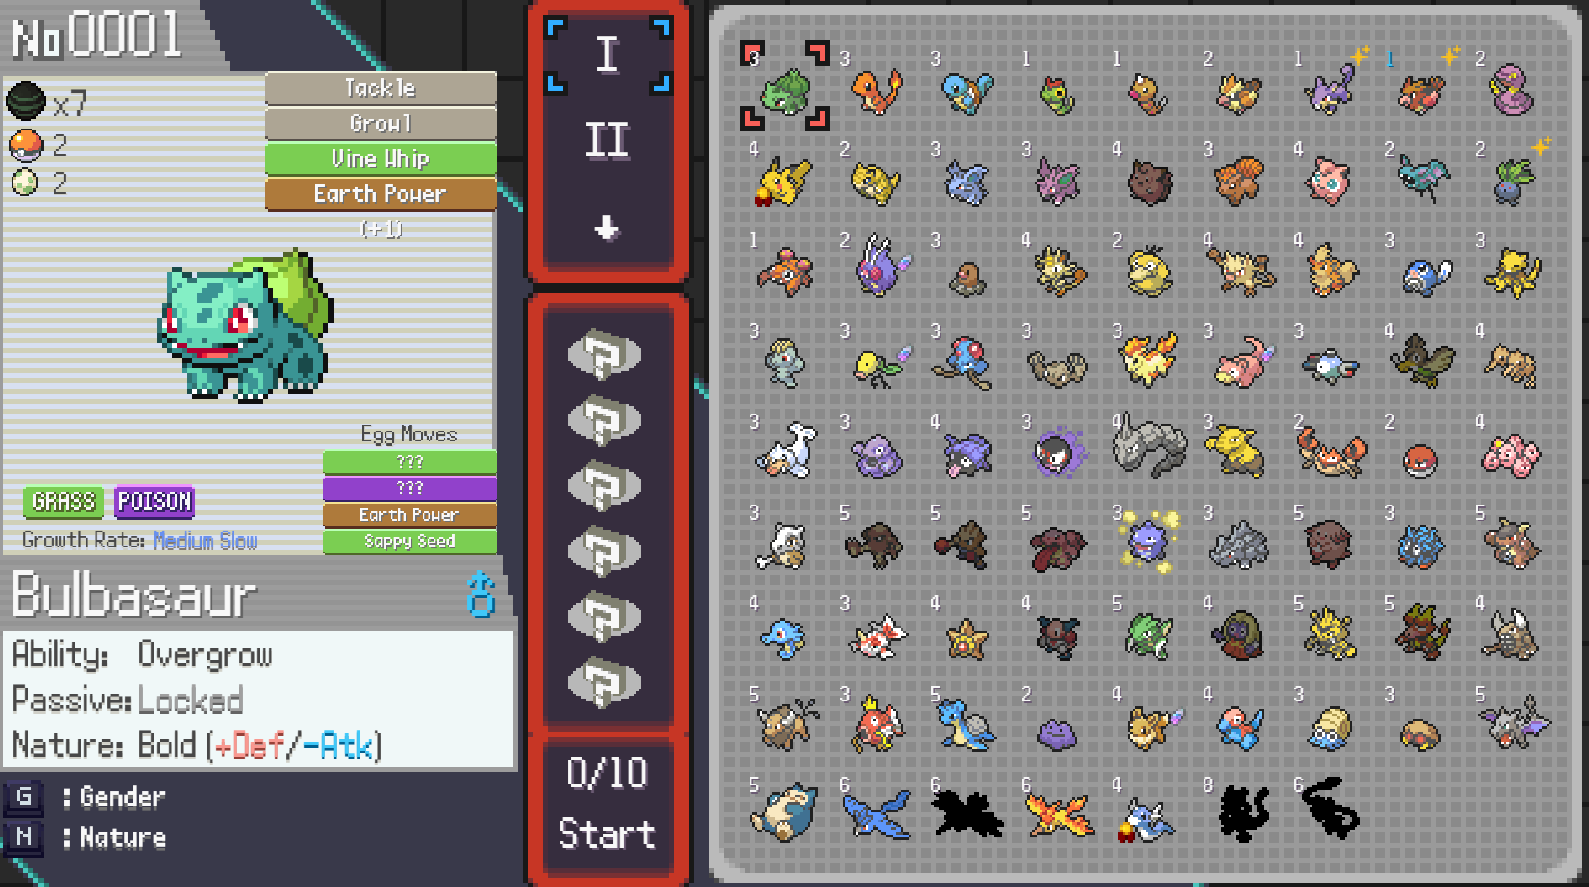
PokéRogue Random Team Selector in R
R
pokerogue
functions
project
Mastering Regular Expressions: Dealing with String Data in R, Part II
R
tidyverse
regex
string
text
Mastering Regular Expressions: Dealing with String Data in R, Part I
R
tidyverse
regex
string
text
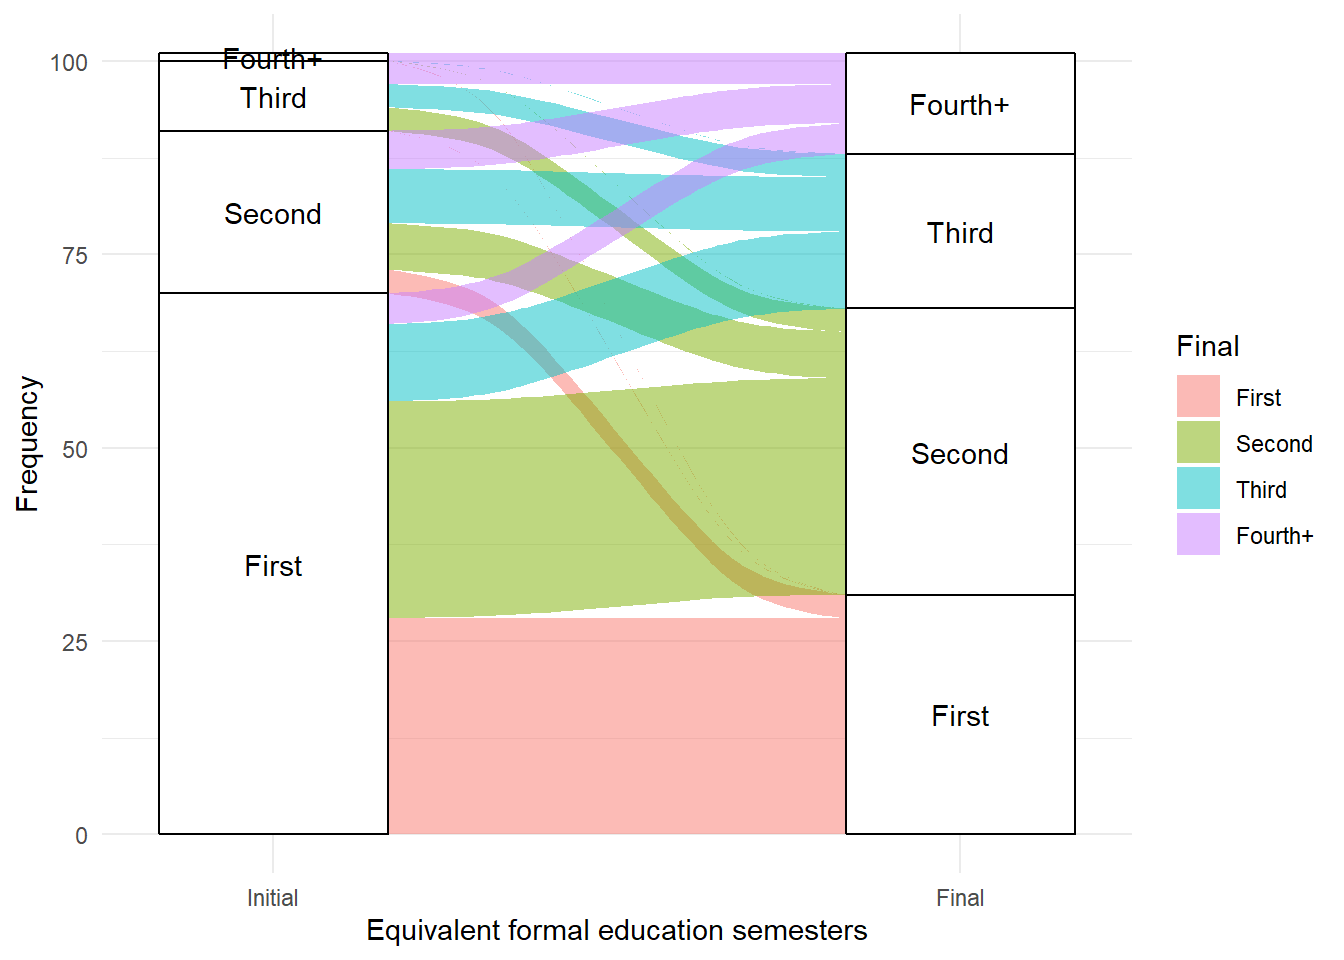
How to Create an Alluvial Plot in R
ggplot
plot
alluvial
R
No matching items